.jpg)


A Real Estate Market Study
This study analyzed 1,123 detached single-family home sales in Highlands Ranch, Colorado between January 1 and December 31, 2025. The analysis compares original list price to net close price — the amount sellers received after price reductions and buyer concessions.
Key Findings
The 30-Day Window
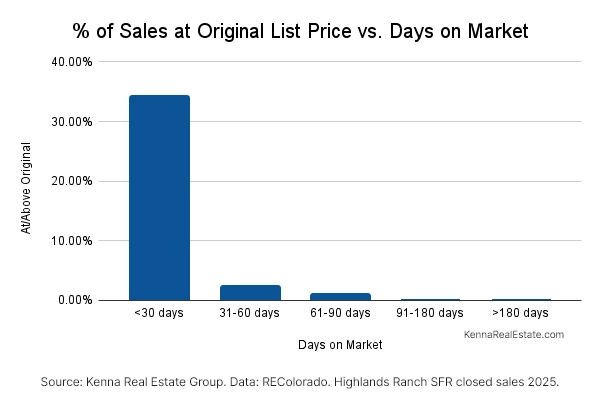
34.3% of properties that sold within 30 days received their original list price. After 30 days, that dropped to 2.5%. After 60 days, 1.1%. After 90 days, zero.
The Escalating Cost
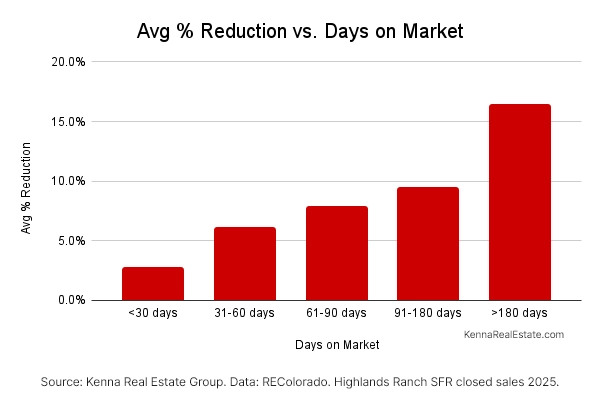
Average price reductions increased with time on market: 2.7% at under 30 days, 6.1% at 31-60 days, 7.8% at 61-90 days, 9.4% at 91-180 days, and 16.4% at over 180 days.
The Concession Factor
59% of all sales included concessions, averaging $9,971. Concessions increased with time on market from $8,156 at under 30 days to $17,986 at over 180 days.
The Luxury Penalty
Properties listed at $1,000,000 or more averaged 45 days on market compared to 24 days for properties under $600,000. When $1,000,000+ properties sold below original price, the average reduction was 7.4% compared to 3.4% for properties under $600,000.
The $800,000 Challenge
The $800,000-$899,999 price range had the lowest success rate — only 17.4% sold at original price, compared to 25-26% in adjacent price ranges.
This study shows correlation, not causation. Properties that sell quickly tend to achieve better prices. But the relationship works both ways — well-priced properties sell faster, and overpriced properties sit. Condition, location, seasonality, and pricing strategy all influence days on market. This data describes what happened in 2025. It does not predict individual outcomes.
All Detached Single-Family Homes
By Price Range
The following tables break down the data by six price ranges:
under $600,000 | $600,000-$699,999 | $700,000-$799,999 | $800,000-$899,999 | $900,000-$999,999 | $1,000,000 or more
Under $600,000
134 properties | Average days on market: 24
$600,000-$699,999
314 properties | Average days on market: 30
$700,000-$799,999
213 properties | Average days on market: 37
$800,000-$899,999
144 properties | Average days on market: 34
$900,000-$999,999
84 properties | Average days on market: 32
$1,000,000 or More
234 properties | Average days on market: 45
Concessions
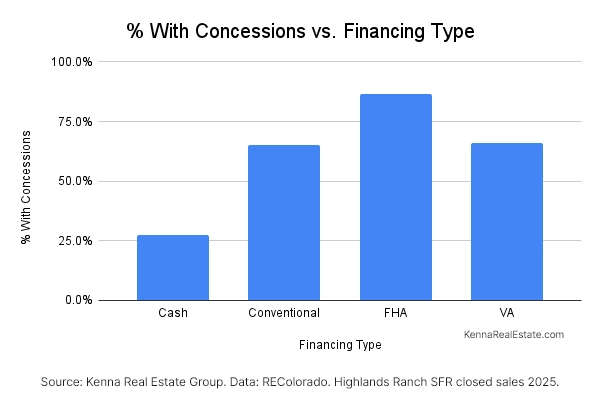
Concessions — credits paid by sellers to buyers at closing, typically used for closing costs or to buy down the interest rate — are part of the total cost to sellers. In Highlands Ranch in 2025, 59% of all sales included concessions.
Concessions by Financing Type
| Financing Type | Sales | % With Concessions | Avg Concession |
|---|---|---|---|
| Cash | 196 | 27.6% | $6,515 |
| Conventional | 816 | 65.3% | $9,811 |
| FHA | 45 | 86.7% | $17,933 |
| VA | 53 | 66.0% | $9,378 |
Concessions by Days on Market
| Days on Market | % With Concessions | Avg Concession |
|---|---|---|
| <30 days | 60% | $8,156 |
| 31-60 days | 62% | $11,999 |
| 61-90 days | 61% | $12,559 |
| 91-180 days | 55% | $13,363 |
| >180 days | 62% | $17,986 |
Concessions by Price Range
| Price Range | % With Concessions | Avg Concession |
|---|---|---|
| Under $600,000 | 71% | $8,701 |
| $600,000-$699,999 | 65% | $8,934 |
| $700,000-$799,999 | 59% | $8,962 |
| $800,000-$899,999 | 63% | $9,921 |
| $900,000-$999,999 | 52% | $10,550 |
| $1,000,000 or more | 46% | $14,023 |
What This Means in Dollars
On the market 30 days or less: Average reduction of $21,600 + average concession of $8,000 = approximately $30,000 below original list price
On themarket 91-180 days: Average reduction of $75,200 + average concession of $13,000 = approximately $88,000 below original list price
The difference: $58,000
Definitions
Original List Price — The price at which the property was first listed on the MLS.
Net Close Price — The final sale price minus any concessions paid by the seller to the buyer. This represents what the seller received.
Days on Market — The number of days from when the property was listed to when it went under contract, as recorded in the MLS.
At/Above Original — Properties where the net close price was equal to or greater than the original list price.
Below Original — Properties where the net close price was less than the original list price.
Concessions — Credits paid by sellers to buyers, typically to cover closing costs. These reduce the seller's net proceeds.
Data Notes
All calculations use original list price compared to net close price (what the seller received after concessions). This methodology captures the true cost to sellers.
Average reductions were calculated using only properties that sold below original price. Median reductions were also calculated for comparison. Results were generally consistent, with medians 0.6 to 1.1 percentage points lower than averages in most DOM brackets. The >180 days bracket showed a larger gap (2.6 points), likely due to small sample size (16 properties).
Reduction percentages and dollar amounts in tables reflect only properties that sold below original list price. This isolates the true cost when a property does not receive its price.
19 off-market sales were excluded from this study as they had no original list price data. 5 duplicate MLS entries (IRES/REcolorado cross-posts) were removed.
Source: REcolorado MLS
Date Range: January 2 – December 31, 2025
Property Type: Detached single-family homes
N: 1,123 sales
Data analysis by AgentCOS
About This Study
Properties Analyzed: 1,123 detached single-family homes
Price Range: $349,900 to $5,750,000
Location: Highlands Ranch, Colorado
Data Source: REcolorado MLS
Time Period: January 1 – December 31, 2025
About Kenna Real Estate Group
Kenna Real Estate Group is a highly respected real estate team partnered with Keller Williams DTC, LLC. For more than 16 years, our agents have been recognized throughout Colorado for their professionalism, market knowledge, and client-first approach. With a 4.9-star Google rating, award-winning REALTORS®, and a reputation for going above and beyond, we are committed to making every transaction as seamless as possible.


