New - 1 Day Ago

.jpg)


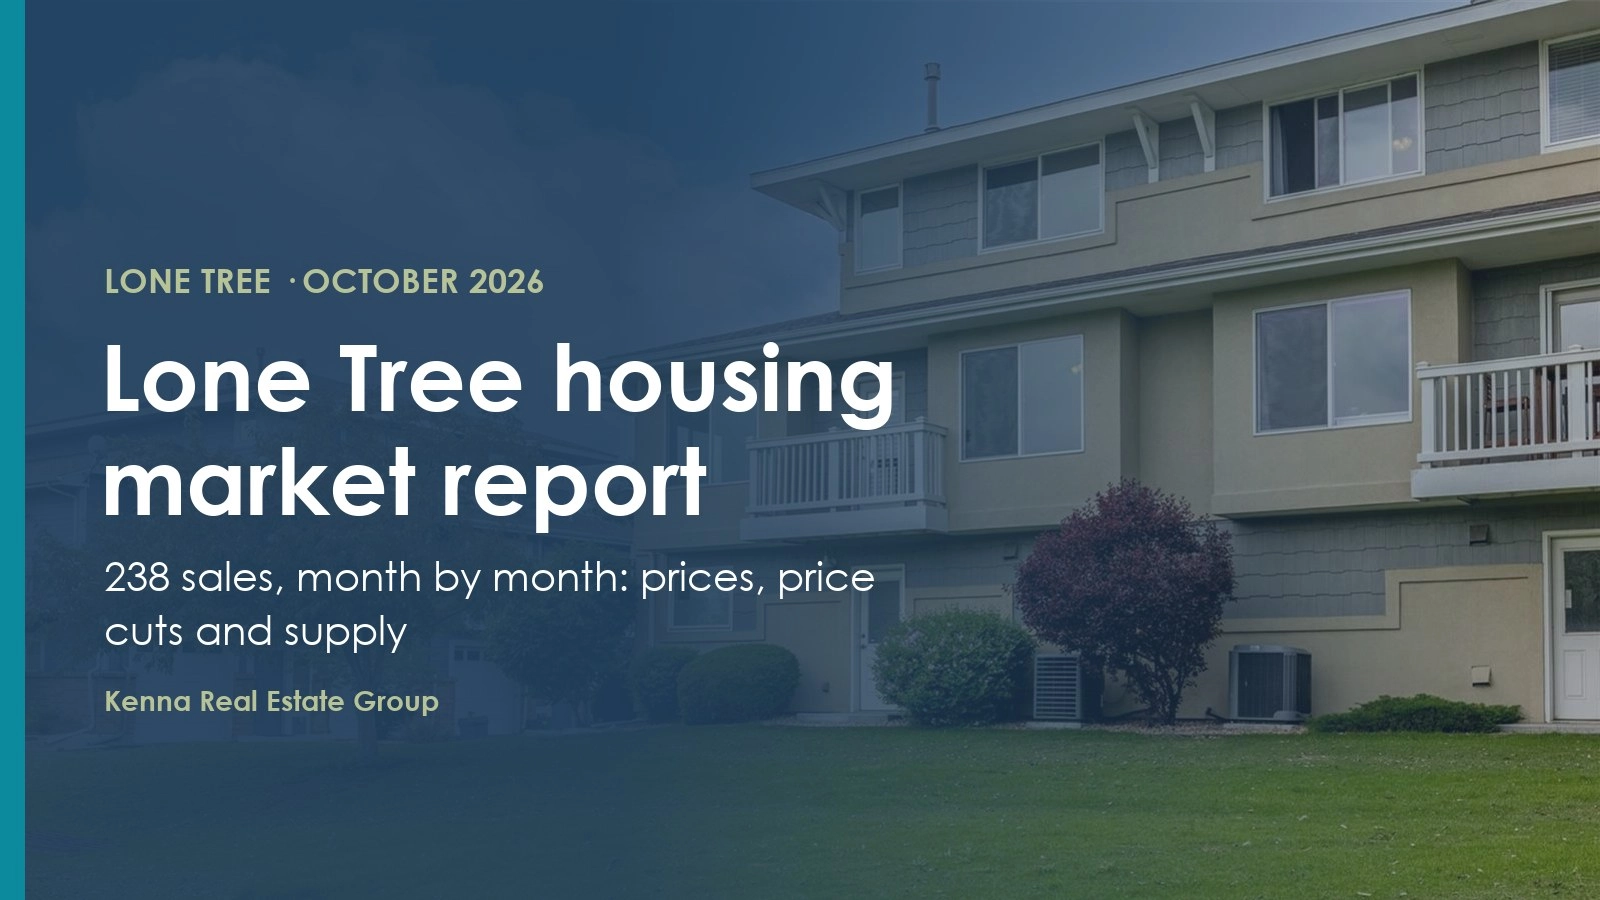
The Lone Tree housing market in October 2026: 238 homes sold from November 2025 through September 2026 at a median price of $806,250 and $294 a square foot. This Lone Tree, Colorado market report tracks every closed sale in the MLS month by month: median and average price, price per square foot, single-family homes vs condos and townhomes, sale-to-list price and months of supply, so you can price a home to sell or know what to offer.
Call or text 303-955-4220. A live person answers. Not a robot, not a phone tree.
$937,000 Single-family median 178 sales, Nov 25 - Sep 26 | $288 Single-family $/sq ft +6.1% Nov to Sep |
2.8 months Single-family supply 55 for sale today | 41% Sellers who cut their price They sold for 92.8% of their first price |
Lone Tree single-family homes have 2.8 months of supply and condos and townhomes 5.6 months, based on the homes for sale today and the last three months of sales.
The median Lone Tree sale peaked at $895,000 in Dec 2025 and was $840,000 in Sep 2026. Single-family homes drive the median; condos and townhomes sell for less and move the monthly number when more of them close.
Single-family homes sold for $288 a square foot in Sep 2026, against $272 in Nov 2025. Price per square foot strips out home size, so it is the cleanest month-to-month read on value.
Spring is the busy season: 30 homes closed in Jun 2026, against 23 in Sep 2026. Fewer closings in the fall mean fewer buyers competing for each home and more room to negotiate.
41% of Lone Tree sellers had to cut their price, and those sellers sold for a median of 92.8% of their original asking price: $68,030 below where they started. Sellers who priced right and never cut sold at 100.0% of asking. Most market reports quote "sale-to-list" against the final, lowered price, which is why the number looks close to 100%. The gap between the two lines below is the cost of starting too high.
41% Of sellers cut their price Lone Tree, Nov 2025 - Sep 2026 | 92.8% What the price-cutters got Of their ORIGINAL asking price |
$68,030 Below their first price Median, sellers who cut | 100.0% Priced right, never cut Of asking price |
The higher the asking price, the larger the share of Lone Tree sellers who had to cut it. This splits every sale by its original list price: how many sellers cut, how deep the typical cut went, and what they sold for against the first price.
Lone Tree sellers who cut their price, by original asking price
| Original asking price | Sales | Cut their price | Typical cut | Sold vs ORIGINAL price |
|---|---|---|---|---|
| Under $500K | 11 | 27% | 2.0% | 98.0% |
| $500K-$700K | 71 | 46% | 4.8% | 97.2% |
| $700K-$900K | 58 | 29% | 2.6% | 98.2% |
| $900K-$1.2M | 32 | 41% | 7.0% | 94.3% |
| $1.2M+ | 64 | 47% | 4.1% | 95.6% |
Homes that closed within 35 days of listing, meaning they went under contract in about the first week, got 100.0% of their original price; homes that took 6+ months got 93.1%. Days run from the first day on the market to the closing date. Once the price drops to where buyers are, the home sells near that price, but the first price decides how much you leave on the table.
Lone Tree: sale price as % of ORIGINAL list price, by time on market
| Time from listing to closing | Sales | % of original price | Cut their price | Median given up from original price |
|---|---|---|---|---|
| Closed within 35 days | 53 | 100.0% | 4% | $0 |
| 36-60 days | 56 | 98.6% | 16% | $10,000 |
| 61-90 days | 40 | 95.7% | 52% | $34,450 |
| 91-120 days | 26 | 94.0% | 65% | $62,000 |
| 4-6 months | 27 | 93.7% | 70% | $41,188 |
| 6+ months | 34 | 93.1% | 82% | $68,030 |
Set your asking price and drag the days until an accepted offer to see what Lone Tree homes really sold for. Homes that closed within 35 days of listing got 100.0% of their original price.
Price it right the first time. Seller-paid concessions (closing costs, rate buydowns) come on top of these price cuts and are not part of the sale price.
| Month | Sales | Median price | Average price | Single-family median | Median $/sq ft | Sold vs ORIGINAL price | Had a price cut |
|---|---|---|---|---|---|---|---|
| Nov 2025 | 21 | $860,000 | $929,748 | $993,605 | $284 | 95.7% | 52% |
| Dec 2025 | 16 | $895,000 | $1,030,514 | $947,500 | $285 | 96.4% | 44% |
| Jan 2026 | 8 | $772,668 | $746,967 | $837,500 | $313 | 93.8% | 50% |
| Feb 2026 | 16 | $659,250 | $884,994 | $918,485 | $308 | 96.7% | 31% |
| Mar 2026 | 28 | $722,500 | $872,295 | $827,500 | $288 | 99.4% | 41% |
| Apr 2026 | 19 | $740,000 | $815,129 | $877,500 | $296 | 100.0% | 32% |
| May 2026 | 26 | $825,000 | $939,557 | $989,420 | $275 | 97.6% | 20% |
| Jun 2026 | 30 | $837,500 | $1,012,568 | $937,200 | $289 | 96.3% | 50% |
| Jul 2026 | 28 | $813,130 | $1,029,934 | $1,087,500 | $307 | 95.6% | 43% |
| Aug 2026 | 23 | $870,000 | $1,014,623 | $1,045,000 | $311 | 95.2% | 52% |
| Sep 2026 | 23 | $840,000 | $1,023,725 | $1,041,000 | $292 | 98.0% | 35% |
Sales with a Lone Tree address in each ZIP. Several of these ZIPs also cover parts of neighboring cities, which are not counted here.
| ZIP | Sales | Median price | Median $/sq ft | Sold vs ORIGINAL price |
|---|---|---|---|---|
| 80124 | 204 | $796,500 | $289 | 97.3% |
| 80134 | 34 | $904,950 | $354 | 96.8% |
Lone Tree closed sales by price, Nov 25 - Sep 26


$806,250 for all homes sold from November 2025 through September 2026, and $937,000 for single-family homes. In Sep 2026 the median was $840,000.
Single-family homes sold for a median of $288 a square foot in Sep 2026 and $288 over the last 11 months.
Single-family homes had 2.8 months of supply in early October 2026 and condos and townhomes 5.6 months. Under 4 months favors sellers, over 6 favors buyers.
The median sale was $840,000 in Sep 2026 against a peak of $895,000 in Dec 2025; single-family price per square foot moved +6.1% from Nov 2025 to Sep 2026.
41% of Lone Tree sellers cut their price from November 2025 through September 2026, and they sold for a median of 92.8% of their original asking price, $68,030 below where they started. Homes that closed within 35 days of listing got 100.0% of the original price.
22 a month on average over the last 11 months, from 8 in the slowest month to 30 in the busiest.
Call or text 303-955-4220. A live person answers. Not a robot, not a phone tree.
Brian Lee Burke, the hardest working man in real estate
Kenna Real Estate Group at Keller Williams DTC. Helping You With Your Pad™ since 2002.


