New - 1 Day Ago
$626,255
Active
4
Beds
3
Baths
2768
Sqft
0.17
Acres
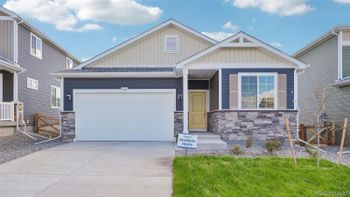
17598 E 103rd Dr, Commerce City, CO 80022
MLS#: 9826521
.jpg)



The Front Range market moved from the extreme seller's conditions of 2021 and 2022 toward more balanced conditions in 2025, with inventory higher than the pandemic-era lows and homes taking longer to sell than they did at the peak. That shift changes strategy for both buyers and sellers heading into 2026: buyers get more negotiating room and more time to decide, while sellers need sharper pricing and better presentation to compete.
Price movement varies by city and by price band across the Front Range rather than moving as one number. Entry-level homes in Aurora, Thornton and Commerce City have held value better than higher-priced homes in some Denver neighborhoods, since more buyers compete at lower price points where affordability constraints bite hardest. Track the actual numbers for your target area rather than a national average at the Kenna Colorado market reports page and the hottest and coldest Denver ZIP codes report, both updated with current local data.
Mortgage rates remain the single biggest driver of what buyers can afford, and even a half-point move changes monthly payments meaningfully on a Front Range median-priced home. Buyers who locked in a rate below current market levels in past years have less incentive to sell and move, which keeps resale inventory lower than it would otherwise be, a pattern known as rate lock-in. Watch Federal Reserve policy announcements and 10-year Treasury yield movement, both of which move mortgage rates ahead of any official rate change. Colorado buyers working with Mike Oswald at Rate (NMLS 261003, Equal Housing Lender) can lock a rate and estimate their real monthly payment before writing an offer; you are free to use any lender. Start at Colorado home financing.
A market is considered balanced when there is close to a five- to six-month supply of homes at the current sales pace; below that favors sellers, above that favors buyers. Front Range inventory sits closer to balanced than it did during the tightest years of the pandemic, though this varies sharply by city and price point within the metro. Check current absorption rates for your specific area before deciding on a listing or offer strategy, since a citywide average can mask a tight or loose submarket within it.
Cities that continue approving new housing supply, including higher-density infill near transit corridors in Denver and Aurora, tend to see more measured price growth than cities with tighter zoning and limited new construction. Investor and industry voices outside Colorado echo the same pattern in other growing Western markets; Nathan Polatis of House Buyer Salt Lake City has pointed to flexible local zoning as a consistent driver of long-term market performance in fast-growing metro areas. Colorado's own zoning debates, particularly around accessory dwelling units and middle housing, follow a similar logic. See the Denver ADU, zoning and historic district guide for the current local rules.
New construction in Castle Rock, Parker, Commerce City and parts of Aurora competes directly with resale inventory in the same price bands, and builder incentives like rate buydowns and closing-cost credits can pull buyers away from comparable resale listings. Sellers competing against active new-build communities need to account for those incentives when setting an asking price, since a buyer comparing your resale listing against a new-build competitor is also comparing the builder's incentive package. Compare current new-construction activity at new construction homes in Colorado by area.
Institutional and local investors alike have shifted focus toward rental-property fundamentals and longer holding periods rather than short-term price speculation, a pattern consistent across most U.S. metro markets coming out of the rapid price growth of 2021 and 2022. Local investors continue to play a meaningful role in the Front Range, particularly in renovating older housing stock in established Denver neighborhoods. Colorado investors evaluating a hold can review current numbers at the Colorado real estate investing guide and the rental property checklist.
Get a specific pricing opinion for your home rather than relying on an automated estimate at pricing your Colorado home to sell.
A more balanced market gives buyers time to negotiate on price, closing costs and inspection repairs that was not available during the tightest years of the pandemic. Use that time to get a full inspection, including a structural check on any home showing foundation movement common in the Front Range's expansive clay soil, rather than waiving contingencies to compete. Track additional market data sources alongside local reports, including broader housing analytics platforms such as Poggers, to see how Colorado trends compare to other regions before you set your offer strategy.
A home's list price is not the full monthly cost on the Front Range. New construction inside a metro district carries a separate mill levy on top of county property tax, and HOA dues add a third line item most affordability calculators skip. Factor all three into your monthly budget comparison across neighborhoods rather than comparing list prices alone. See the Denver special district and metro district tax guide.
Look past the citywide median price and check three numbers specific to your target ZIP code: months of supply, average days on market, and the ratio of sale price to original list price. A ZIP code with rising days on market and a sale-to-list ratio below 98% favors buyer negotiation; the reverse favors sellers. Pull current numbers by ZIP code at the Kenna hottest and coldest Denver ZIP codes report before you set a price or an offer strategy.
The Front Range follows a fairly consistent seasonal pattern regardless of the broader rate environment: listing activity picks up in March, peaks through June, and slows from October through January. Homes listed in late fall through winter face less competition from other sellers but also see fewer active buyers touring, which tends to extend days on market even in a strong underlying demand environment. Plan your listing timing around your own move date first, and use your ZIP code's specific seasonal data as a secondary check rather than a rule that applies evenly across every Front Range city.
The Kenna Real Estate Group tracks Front Range inventory, days on market and pricing by ZIP code so buyers and sellers make decisions based on your specific submarket, not a national headline. Call or text 303-955-4220. A live person answers. Not a robot, not a phone tree. See what's on the market right now at search every home for sale in Colorado.
Questions about any home in Colorado? Call or text 303-955-4220. A live person answers.
It varies by city and price band within the Front Range. Check months of supply and days on market for your specific ZIP code at the Kenna market reports page rather than relying on a citywide average.
Rate movement depends on inflation data and Federal Reserve policy, both of which change through the year. Lock a rate with your lender once you are under contract rather than timing the market.
Yes. Builder incentives like rate buydowns and closing-cost credits in Castle Rock, Parker and Commerce City pull buyers who would otherwise consider a comparable resale listing, so sellers should account for those incentives when pricing.
A market with roughly five to six months of supply at the current sales pace is considered balanced. Below that favors sellers; above that favors buyers.
A metro district adds its own mill levy on top of county property tax, separate from any HOA dues, which can add several hundred dollars a month to the real cost of a new-build home.
Base the decision on your specific neighborhood's current inventory and days-on-market numbers, plus your own timeline, rather than waiting for a citywide shift that does not necessarily affect your submarket the same way.